Friday, July 31, 2015
Thursday, July 30, 2015
Summer coming to swift conclusion (A KASB Excerpt)
Summer coming to swift conclusion
 The summer months are coming to a swift conclusion. The month of July may seem like a slow period to the average patron. Most are not aware of the importance of the period between the conclusion of school and the beginning of school for students and staff. District patrons in an attempt to be polite ask repeatedly of your board office staff, “What do you do in the summer?”
Let’s attempt to answer that question. The budget has been scrutinized and created. Your superintendent and assistant superintendent has traveled to Topeka to have the proposed budget reviewed by the budget experts at KSDE. Special board meetings were held to review the budget and approve its publication. The budget hearing is scheduled and eventually the district’s budgets are submitted to the county clerk and state department of education.
Many of your principals are frantically attempting to hire new staff to fill needed openings. The special education cooperatives are desperately trying to fill their classified positions. New board members have started their service, new board presidents have been placed, and staff meetings and professional learning and staff meetings are under way.
In the midst of the summer chaos, your district office staff is attempting to get contracts and work agreements produced and mailed for signatures. They are trying to make sense of the changes in your health insurance and other human relations issues so they can be the resident experts to answer employee questions.
Monday, July 27, 2015
Kansas and Missouri Teacher Salaries - Just the Facts (A report from KASB)
On Friday, the media reported Gov. Sam Brownback used teacher salary information for Kansas and Missouri that was not comparable; making it appear as though Kansas teachers earned more than Missouri teachers. You can read an example here.
The issue was apparently that the numbers Brownback used came from KSDE and included supplementals and board paid fringe benefits, whereas the Missouri numbers did not include these things.
In response, KASB wanted to present comparable information as reported by the National Center for Education Statistics in their annual Digest of Education Statistics. The following figures are from a table that can be found online here:
Average Teacher Salaries by State
United States | Kansas | Missouri | ||||
Current $ | Constant $ | Current $ | Constant $ | Current $ | Constant $ | |
1970 | $ 8,626 | $ 53,655 | $ 7,612 | $ 47,348 | $ 7,799 | $ 48,511 |
1980 | $ 15,970 | $ 48,335 | $ 13,690 | $ 41,434 | $ 13,682 | $ 41,410 |
1990 | $ 31,367 | $ 58,044 | $ 28,744 | $ 53,190 | $ 27,094 | $ 50,137 |
2000 | $ 41,807 | $ 58,025 | $ 34,981 | $ 48,551 | $ 35,656 | $ 49,488 |
2010 | $ 55,202 | $ 59,845 | $ 46,657 | $ 50,582 | $ 45,317 | $ 49,129 |
2013 | $ 56,103 | $ 56,979 | $ 47,464 | $ 48,205 | $ 47,517 | $ 48,259 |
2014 | $ 56,689 | $ 56,689 | $ 48,221 | $ 48,221 | $ 48,329 | $ 48,329 |
The “Current $” columns represent actual dollar amounts, as shown in the chart below:

The “Constant $” columns represent annual changes in the cost of living (to show salaries in 2013-14 dollar amounts), as shown in the chart below:

This data indicates that both Missouri and Kansas salary amounts have been consistently below the national average since 1970. It also indicates that for 1990 and 2010, Kansas’ average teacher salary was above Missouri’s. However, the data for the two most recent years shows Kansas and Missouri with virtually identical average teacher salaries; with Missouri showing a slightly higher salary in both years.
This is contrary to Gov. Brownback’s assertion that “Kansas average teacher salary has increased every year since 2010, and last school year totaled $54,907. This compared to Missouri, where teachers have experienced two pay cuts since 2010, and average just $47,847 per year.”
Wednesday, July 22, 2015
Why are school districts cutting budgets when total funding is up?
Tuesday, July 21, 2015 by Mark Tallman (Kansas Association of School Boards)
Tallman Education Report: Why are school districts cutting budgets when total funding is up?
As school boards across Kansas adopt budgets for the upcoming year, the media is reporting two different situations.
School administrators in some districts have laid off staff and are cutting programs for students while nearly all districts are making tough choices.
But others, such as Gov. Sam Brownback and legislative leaders, are saying that school funding is at an all-time high, and the new block grant system, they say, was designed to protect districts from cuts and provide stability.
Many parents, patrons and even school board members are likely confused by these different perspectives. The facts are really fairly simple. Although total funding is up, the part of school funding available for day-to-day operating costs is not keeping up with inflation and enrollment.
- Operating funding per pupil has not kept pace with inflation since 2009 even though total funding per pupil is at an all-time high.
School funding falls into several big categories. The money school boards can use for general educational purposes, from paying teacher salaries to heating, cooling and lighting buildings to busing students, comes from general state aid, special education state aid, and a local option budget. These are state and local operating funds, and they represent about two-thirds of total funding.
The remaining third is made up of federal funding for education programs, food service costs (funded by both federal aid and student meal fees), state contributions to the Kansas Public Employees Retirement System, costs of buildings and equipment approved by district voters or from local capital outlay tax levies, and other student fees for textbooks, etc. By law, none of these funds can be used for “general” operating costs.
Total school district funding is, in fact, at an all-time high, expected to top $6.1 billion this year. Following the Montoy school finance decision by the Kansas Supreme Court in 2005, funding increased rapidly, then declined following the Great Recession before beginning a slower rate of increase.
However, state and local operating budgets, which include each school district’s general fund, state special education aid and local option budgets, took a bigger hit following the recession, and recovered much more slowly. In fact, state and local operating budgets for the school year that just ended were at the same level as in 2009, although inflation has increased nearly 10 percent.
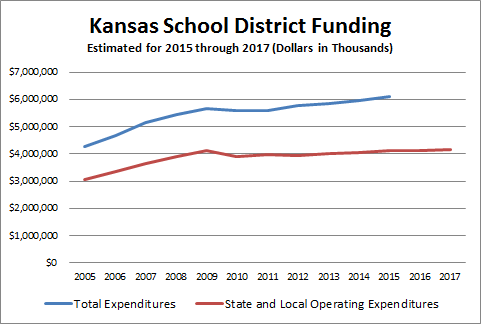
(Dollars in Thousands) | ||
Total Expenditures | State and Local Operating Expenditures | |
2005 | $4,289,415 | $3,061,172 |
2006 | $4,689,295 | $3,366,474 |
2007 | $5,142,077 | $3,644,340 |
2008 | $5,446,453 | $3,918,061 |
2009 | $5,666,732 | $4,114,725 |
2010 | $5,589,549 | $3,922,115 |
2011 | $5,587,044 | $3,967,882 |
2012 | $5,771,010 | $3,951,270 |
2013 | $5,852,471 | $4,024,580 |
2014 | $5,975,518 | $4,064,765 |
2015 | $6,100,000 | $4,113,740 |
2016 | $4,136,866 | |
2017 | $4,163,304 | |
Total funding does not take into account changes in student enrollment, which has been increasing. Total Kansas per pupil spending is at its highest point ever, projected to be over $13,000 in 2015. However, state and local operating funds per pupil is still below the 2009 level.
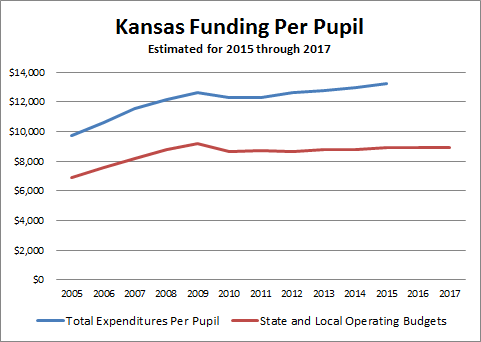
Total Expenditures Per Pupil | State and Local Operating Budgets | |
2005 | $9,707 | $6,928 |
2006 | $10,596 | $7,607 |
2007 | $11,558 | $8,192 |
2008 | $12,188 | $8,768 |
2009 | $12,660 | $9,193 |
2010 | $12,330 | $8,652 |
2011 | $12,283 | $8,723 |
2012 | $12,656 | $8,665 |
2013 | $12,781 | $8,789 |
2014 | $12,960 | $8,816 |
2015 | $13,246 | $8,933 |
2016 | $8,938 | |
2017 | $8,951 |
Finally, actual dollars do not show the impact of inflation. The following chart shows per pupil funding adjusted by the consumer price index to 2014 dollars. Total spending per pupil, when adjusted to 2014 dollars, is actually below 2007 levels. Operating dollars per pupil have actually declined when adjusted for inflation every year since 2009, and are projected to do so for the next two years under the block grants approved by the 2015 Legislature.
In short, Kansas school funding is like a family budget in which income may be increasing each year, but it has failed to keep pace with inflation and other extra costs. That family’s “real purchasing power” is actually dropping. Just like a family, when a school district’s expenses exceed income, the district must make cuts.
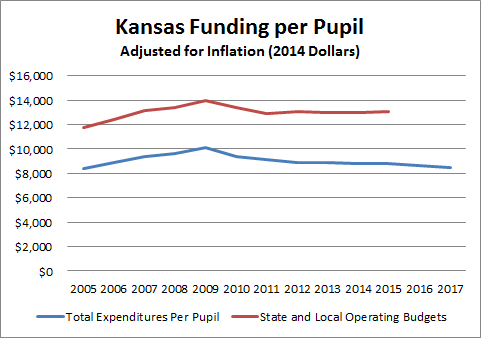
Inflation-Adjusted | ||
State and Local Operating Budgets | Total Expenditures Per Pupil | |
2005 | $8,388 | $11,753 |
2006 | $8,922 | $12,428 |
2007 | $9,342 | $13,181 |
2008 | $9,629 | $13,385 |
2009 | $10,132 | $13,953 |
2010 | $9,382 | $13,370 |
2011 | $9,170 | $12,911 |
2012 | $8,924 | $13,034 |
2013 | $8,921 | $12,973 |
2014 | $8,816 | $12,960 |
2015 | $8,827 | $13,089 |
2016 | $8,651 | |
2017 | $8,484 | |
2. In the next two years, per pupil operating funding is projected to fall behind inflation under the block grant system.
The block grant bill passed by the 2015 Legislature basically did three things. First, it cut the state aid formula for local option budget and capital outlay state aid, so most districts did not receive as much funding as expected last year. This, in turn, required these districts to reduce their budgets during the year.
Second, it locked in most funding for school operating budgets for the next two years at the same level as the current year. In other words, it “froze” funding levels regardless of changes in student enrollment, special needs or inflation.
Third, it provided increased funding for KPERS pension contributions over the next two years - but districts can’t use these funds for any other purpose. KPERS aid is simply transferred to the district, then immediately transferred out.
When districts talk about budget cuts for the next two years under the block grants, it generally means they have rising fixed costs for salaries, insurance, utilities, and in many cases additional students. Because the block grant freezes operating funds, the district must find cuts in other parts of the budget to cover these additional expenses.
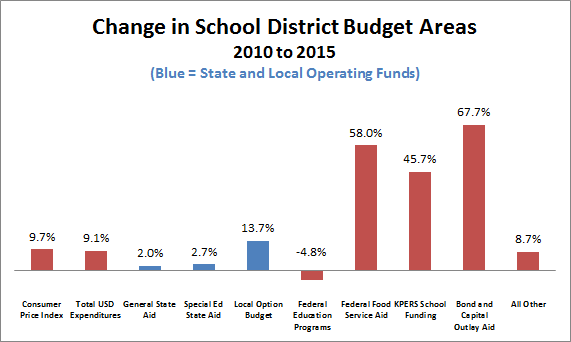
3. While total K-12 funding has increased over the past five years, most of the increase has not been available for regular educational operating costs.
School funding is not interchangeable. Districts have significant flexibility within some parts of their budget, and much less flexibility in others. Over the past five years, the flexible parts of school budgets have increased much less than restricted funding areas.
Since 2010, total funding for school districts increased by $510 million, but general operating funds from the state account for only $53 million, or about 10 percent of the total. Special education aid has barely changed. Local Option Budgets have increased by $127 million, or about one-quarter of the increase. The state legislature provided a large increase in LOB aid that took place last year (2015) to comply with a Supreme Court order. However, most of this increase had to be used to reduce local LOB mill levies, not to provide districts with additional spending power.
Over past five years, federal funding for education programs such Title I, special education federal aid and career and technical education aid has actually declined. However, federal meal support has increased due to the higher number of low income children. In fact, federal food aid accounted for more funding in the past five years than general state aid.
KPERS contributions for school employee retirement benefits increased by nearly $100 million, as the state has increased contributions to the underfunded pension system, but none of those dollars can be used for regular classroom expenses. In addition, state aid for bond payments and capital outlay expenditures - which can only be used for those purposes - increased nearly $90 million, because local voters have approved a number of school bond projects and the Legislature voted to restore capital outlay aid after another Supreme Court order.
Conclusion
It’s true that from the viewpoint of total dollars, funding for Kansas school districts is rising. However, the rate of increase is less than enrollment and inflation, especially for operating budgets, and the increased funds, such as pension obligations, are devoted to areas that cannot be used for classroom instruction. That means districts must cut positions, programs and services to cover expenses that are increasing faster than resources. This situation is projected to continue for the next two years under the block grant program.
Tuesday, July 21, 2015
Why Teaching is the Most Important Profession
Secretary
of Education at U.S. Department of Education
July 20, 2015
(An Excerpt)
Over the
last 8 - 12 years, huge shifts have been occurring in education that are
continuing to impact teaching and learning today. Some changes are positive,
such as our nation’s record high school graduation rate, narrowing achievement
gaps, and a greater number of students attending college.
But all
types of change—particularly those that have the potential to yield the most
positive outcomes—can be challenging. Change requires that we confront the
status quo. It demands new ways of approaching our work. And it takes resolve
to see new beginnings through to their end.
Now, at a time when educators are
courageously raising the bar for student achievement higher than ever before,
the job of the American teacher has never been more critical to the success of
our children and to the prosperity of our nation.
Educators frequently share that
teaching is the most difficult job that anyone can have—and the most rewarding.
Teachers
are our nation builders—the strength of every profession in our country grows
out of the knowledge and skills that teachers help to instill in our children.
And, as a nation, we must do much,
much more to fully appreciate and support their work.
With the transition to more
rigorous achievement standards and better student assessments, a focus on data
to drive instruction, and the use of technology to personalize learning,
teachers are carrying an incredible amount of responsibility. It’s because of
the teachers across the country who I’ve seen stepping up to the challenge that
I am more optimistic about the state of the teaching profession than ever.
We are in the midst of a new
era—one with more engaging lessons and creativity and innovation, which is
bringing joy back into the classroom. For adults willing to stick with it,
there simply could not be a better time to be a teacher.
The state of teaching is stronger
because teachers everywhere are leading from their classrooms and taking on new
roles to improve education for kids. And we all know, when teaching is
stronger, students benefit with increased engagement and achievement.
There is no better resource for a
school than teachers who are empowered and equipped to solve problems using
their own talent and experience. It does not take a federal initiative or a
state program for teachers to solve the biggest challenges in education. Yet,
for teachers to truly lead large-scale transformation, state and local systems
must be willing to provide teachers both time and training to exercise
leadership. We, at the federal level, support and encourage their efforts. I’m
convinced that we must do more to encourage teachers who long to share in the
responsibility of leading change in our schools.
I’m also
confident about the future of the teaching profession because, in so many places,
education is being put back into the hands of teachers. I know that this work
will take time, but it will get easier as teachers lead the change and as
school leaders and others provide teachers with the time and training to equip
educators as agents of change.
Teaching has never been easy, and it never will be.
It takes heart, commitment and passion. But for all the very real challenges, I am so optimistic about where we are going. Why? Because of the teachers who are entering the field and who are in the field now who will lead the way. They will shape the state of this profession—and the future prospects of our children.
It takes heart, commitment and passion. But for all the very real challenges, I am so optimistic about where we are going. Why? Because of the teachers who are entering the field and who are in the field now who will lead the way. They will shape the state of this profession—and the future prospects of our children.
Subscribe to:
Posts (Atom)